Market Outlook
October 09, 2017
Market Cues
Domestic Indices
Chg (%)
(Pts)
(Close)
Indian markets are likely to open negative tracking global indices and SGX Nifty.
BSE Sensex
0.7
222
31,814
Nifty
0.9
91
9,980
U.S. stocks closed flat for the session after the monthly jobs report showed an
unexpected decrease in employment for the month of September. The report from
Mid Cap
0.9
148
15,840
the Labor Department showed that non-farm payroll employment fell by 33,000
Small Cap
1.1
180
16,629
jobs in September against an expectations of an increase of 90,000 jobs. The NYSE
Bankex
0.6
167
27,210
Arca Oil & Gas Index fell by 0.9 percent on concerns of oversupply. Gold stocks
had a strong session with the NYSE Arca Gold Bugs Index up by 1.3 percent.
Global Indices
Chg (%)
(Pts)
(Close)
UK stocks had a flat session as concerns over Catalonian independence and
Dow Jones
(0.0)
1(2)
22,774
domestic concerns kept sentiment muted. A report by the Recruitment and
Nasdaq
0.1
55
6,590
Employment Confederation and IHS Markit showed that permanent job placements
FTSE
0.2
15
7,523
in the U.K grew at the weakest pace in five months in September.
Nikkei
(00.3
62
20,691
Indian Markets had a strong session with gains across all sectoral indices. Market
Hang Seng
0.3
279
28,458
sentiment was positive due to expectations of relief to small and medium enterprises
Shanghai Com
0.3
9
3,349
from the GST council meeting. The metals index posted strong gains for the session
and closed up 3.1%. The other major gainer for the session was the Oil & gas index,
Advances / Declines
BSE
NSE
which closed up 2.1%.
Advances
1,713
1,175
News Analysis
Declines
1,969
528
Punjab National Bank to auction outstanding loan NPAs worth `1,176cr
Unchanged
111
76
Detailed analysis is on Pg2
Volumes (` Cr)
Investor’s Ready Reckoner
BSE
3,679
Key Domestic & Global Indicator
NSE
27,878
Stock Watch: Latest investment recommendations on 150+ stocks
Refer Pg7 onwards
#Net Inflows (` Cr)
Net
Mtd
Ytd
FII
(5(680)
(2(1,628)
4134,90
Top Picks
CMP
Target
Upside
MFs
8683
4,2,455
1488,79
Company
Sector
Rating
(`)
(`)
(%)
Blue Star
Capital Goods Accumulate
798
850
6.5
Top Gainer
Price (`)
Chg (%)
Dewan Housing FinanceFinancials
Accumulate
547
610
11.6
Asian Granito
Other
Buy
487
570
17.0
Sintexem
129
7.3
Navkar Corporation
Other
Buy
184
265
44.1
Rallis
229
7.3
KEI Industries
Capital Goods
Accumulate
357
380
6.3
Welspunind
70
7.2
More Top Picks on Pg5
Hcl-Insys
51
7.0
Key Upcoming Events
Granules
122
6.4
Previous
Consensus
Date
Region
Event Description
Reading
Expectations
Oct10, 2017 India
Exports YoY%
10.30
Top Loser
Price (`)
Chg (%)
Oct10, 2017 India
Imports YoY%
21.00
Gdl
234.2
(2.74)
Oct10, 2017 UK
Industrial Production (YoY)
0.40
0.90
Dhfl
545.9
(2.36)
Oct12, 2017 India
Industrial Production YoY
1.20
Den
85.85
(2.33)
Oct12, 2017 US
Initial Jobless claims
260.00
More Events on Pg7
Star
838.1
(2.19)
Ttkprestig
6117.55
(2.19)
#as on 06th Oct, 2017
Market Outlook
October 09, 2017
News Analysis
Punjab National Bank to auction outstanding loan NPAs worth
`1,176cr
Punjab National Bank (PNB) has put 32 bad loans with an outstanding loan
exposure of `1,176 crore on auction in order to bring down its NPAs. These non-
performing assets (NPA), include Hanung Toys and Textile, Harbs India, United
Foods, and Harman Textile. The listed toys and textile company is the biggest
defaulter in the list with a consortium lending `2,960cr. PNB has a total exposure
of `771.65 crore to Hanung Toys and Textile. The assets would be auctioned by e-
auction on November 8 and would be conducted by the Delhi zonal office.
As of Q1FY18, the gross NPAs for the bank came in at `5,77,207cr, while the net
NPAs came in at `3,45,727cr. In relative terms, the GNPAs declined to 13.66 per
cent of gross advances, from 13.75 per cent a year earlier. Net NPAs reduced,
both yearly and sequentially, to 8.67 per cent of the net advances. Net NPAs stood
at 9.16 per cent and 7.81 per cent as on Q1FY17 and Q4FY17.
The provisioning to cover bad loans also came down to `2,559.71cr in Q1FY18
from `3,165.67cr in Q1FY17.
Economic and Political News
Coal imports rose to 18.33 mln tonnes in the month of September, an
increase of 9.5 per cent YoY
Govt. to notify new limits on gold transactions to curb black money
RBI confers NBFC status to Peer to Peer lending industry
Corporate News
Jaiprakash Associates board approves debt-restructuring plan
Zydus Cadila receives final approval from US FDA to market Amitriptyline
hydrochloride, an anti-depressant drug
Adani Enterprises announces plans to demerge renewable energy business
Govt increases stake in IDBI Bank to
77.79% from
73.98% through
preferential allotment
Market Outlook
October 09, 2017
Top Picks
Market Cap
CMP
Target
Upside
Company
Rationale
(` Cr)
(`)
(`)
(%)
Strong growth in domestic business due to its leade`hip
in acute therapeutic segment. Alkem expects to launch
Alkem Laboratories
22,138
1,852
2,079
12.3
more products in USA, which bodes for its international
business.
We expect the company would report strong profitability
Asian Granito
1,465
487
570
17.0
owing to better product mix, higher B2C sales and
amalgamation synergy.
Favorable outlook for the AC industry to augur well for
Cooling products business which is out pacing the
Blue Star
7,644
798
850
6.5
market growth. EMPPAC division's profitability to
improve once operating environment turns around.
With a focus on the low and medium income (LMI)
consumer segment, the company has increased its
Dewan Housing Finance
17,137
547
610
11.6
presence in tier-II & III cities where the growth
opportunity is immense.
Loan growth is likely to pick up after a sluggish FY17.
Lower credit cost will help in strong bottom-line growth.
Karur Vysya Bank
8,639
143
180
25.9
Increasing share of CASA will help in NIM
improvement.
High order book execution in EPC segment, rising B2C
KEI Industries
2,780
357
380
6.3
sales and higher exports to boost the revenues and
profitability
Expected to benefit from the lower capex requirement
Music Broadcast
2,238
392
434
10.6
and 15 year long radio broadcast licensing.
Massive capacity expansion along with rail advantage
Navkar Corporation
2,623
184
265
44.1
at ICD as well CFS augur well for the company
Strong brands and distribution network would boost
Siyaram Silk Mills
2,276
2,428
2,600
7.1
growth going ahead. Stock currently trades at an
inexpensive valuation.
Market leaderhip in Hindi news genre and no.
2
viewe`hip ranking in English news genre, exit from the
TV Today Network
2,153
361
435
20.5
radio business, and anticipated growth in ad spends by
corporates to benefit the stock.
After GST, the company is expected to see higher
volumes along with improving product mix. The Gujarat
Maruti Suzuki
2,38,941
7,910
8,658
9.5
plant will also enable higher operating leverage which
will be margin accretive.
We expect loan book to grow at 24.3% over next two
GIC Housing
2,754
512
655
28.1
year; change in borrowing mix will help in NIM
improvement..
Source: Company, Angel Research
Market Outlook
October 09, 2017
Key Upcoming Events
Global economic events release calendar
Bloomberg Data
Date
Time
Country
Event Description
Unit
Period
Last Reported
Estimated
Oct 10, 2017
India
Exports YoY%
% Change
Sep
10.30
India
Imports YoY%
% Change
Sep
21.00
2:00 PMUK
Industrial Production (YoY)
% Change
Aug
0.40
0.90
Oct 12, 2017
5:30 PMIndia
Industrial Production YoY
% Change
Aug
1.20
6:00 PMUS
Initial Jobless claims
Thousands
Oct 7
260.00
US
Producer Price Index (mom)
% Change
Sep
0.50
Oct 13, 2017
6:00 PMUS
Consumer price index (mom)
% Change
Sep
0.40
0.60
China
Exports YoY%
% Change
Sep
5.60
9.80
Oct 16, 2017
12:00 PMIndia
Monthly Wholesale Prices YoY%
% Change
Sep
3.24
7:00 AMChina
Consumer Price Index (YoY)
% Change
Sep
1.80
1.60
Oct 17, 2017
2:30 PMEuro Zone
Euro-Zone CPI (YoY)
%
Sep F
1.50
6:45 PMUS
Industrial Production
%
Sep
(0.90)
(0.10)
2:00 PMUK
CPI (YoY)
% Change
Sep
2.90
Oct 18, 2017
6:00 PMUS
Housing Starts
Thousands
Sep
1,180.00
1,200.00
6:00 PMUS
Building permits
Thousands
Sep
1,272.00
1,260.00
7:30 AMChina
Industrial Production (YoY)
% Change
Sep
6.00
6.70
Oct 19, 2017
2:00 PMUK
Jobless claims change
% Change
Sep
(2.80)
7:30 AMChina
Real GDP (YoY)
% Change
3Q
6.90
6.80
Oct 20, 2017
7:30 PMUS
Existing home sales
Million
Sep
5.35
5.36
Oct 23, 2017
7:30 PMEuro Zone
Euro-Zone Consumer Confidence
Value
Oct A
(1.20)
Oct 24, 2017
1:00 PMGermany
PMI Manufacturing
Value
Oct P
60.60
1:00 PMGermany
PMI Services
Value
Oct P
55.60
Oct 25, 2017
2:00 PMUK
GDP (YoY)
% Change
3Q A
1.50
7:30 PMUS
New home sales
Thousands
Sep
560.00
Source: Bloomberg, Angel Research
Market Outlook
October 09, 2017
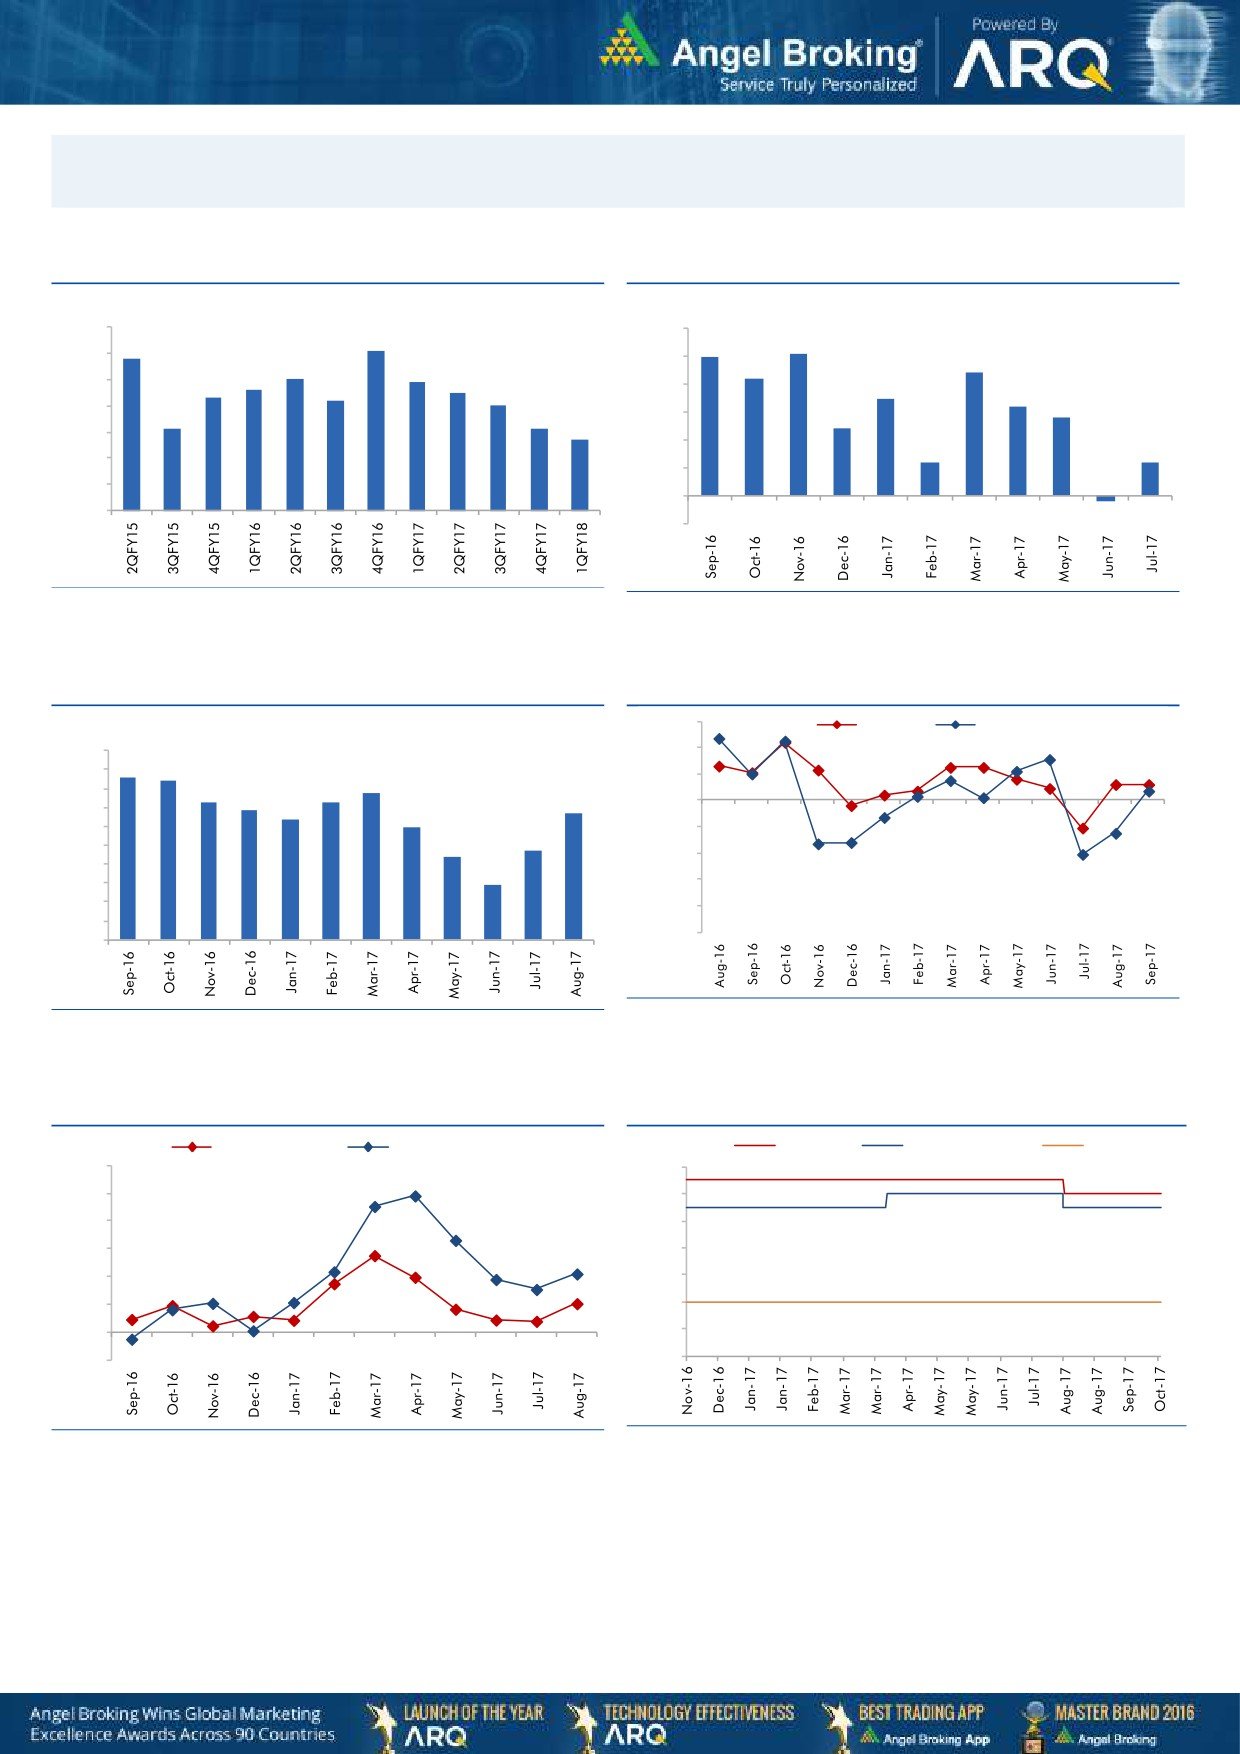
Macro watch
Exhibit 1: Quarterly GDP trends
Exhibit 2: IIP trends
(%)
(%)
10.0
6.0
9.1
5.1
8.8
5.0
9.0
5.0
4.4
8.0
7.9
4.2
7.6
7.5
8.0
7.3
7.2
4.0
3.5
7.0
3.2
2.8
7.0
6.1
6.1
3.0
2.4
5.7
6.0
2.0
1.2
1.2
5.0
1.0
4.0
-
3.0
(1.0)
(0.2)
Source: CSO, Angel Research
Source: MOSPI, Angel Research
Exhibit 3: Monthly CPI inflation trends
Exhibit 4: Manufacturing and services PMI
56.0
Mfg. PMI
Services PMI
(%)
5.0
54.0
4.3
4.2
4.5
3.9
52.0
4.0
3.6
3.7
3.4
3.4
3.2
50.0
3.5
3.0
3.0
48.0
2.4
2.2
2.5
46.0
2.0
1.5
1.5
44.0
1.0
42.0
0.5
40.0
-
Source: Market, Angel Research; Note: Level above 50 indicates expansion
Source: MOSPI, Angel Research
Exhibit 5: Exports and imports growth trends
Exhibit 6: Key policy rates
(%)
Exports yoy growth
Imports yoy growth
(%)
Repo rate
Reverse Repo rate
CRR
60.0
6.50
50.0
6.00
40.0
5.50
30.0
5.00
20.0
4.50
10.0
4.00
0.0
3.50
(10.0)
3.00
Source: Bloomberg, Angel Research
Source: RBI, Angel Research
Market Outlook
October 09, 2017
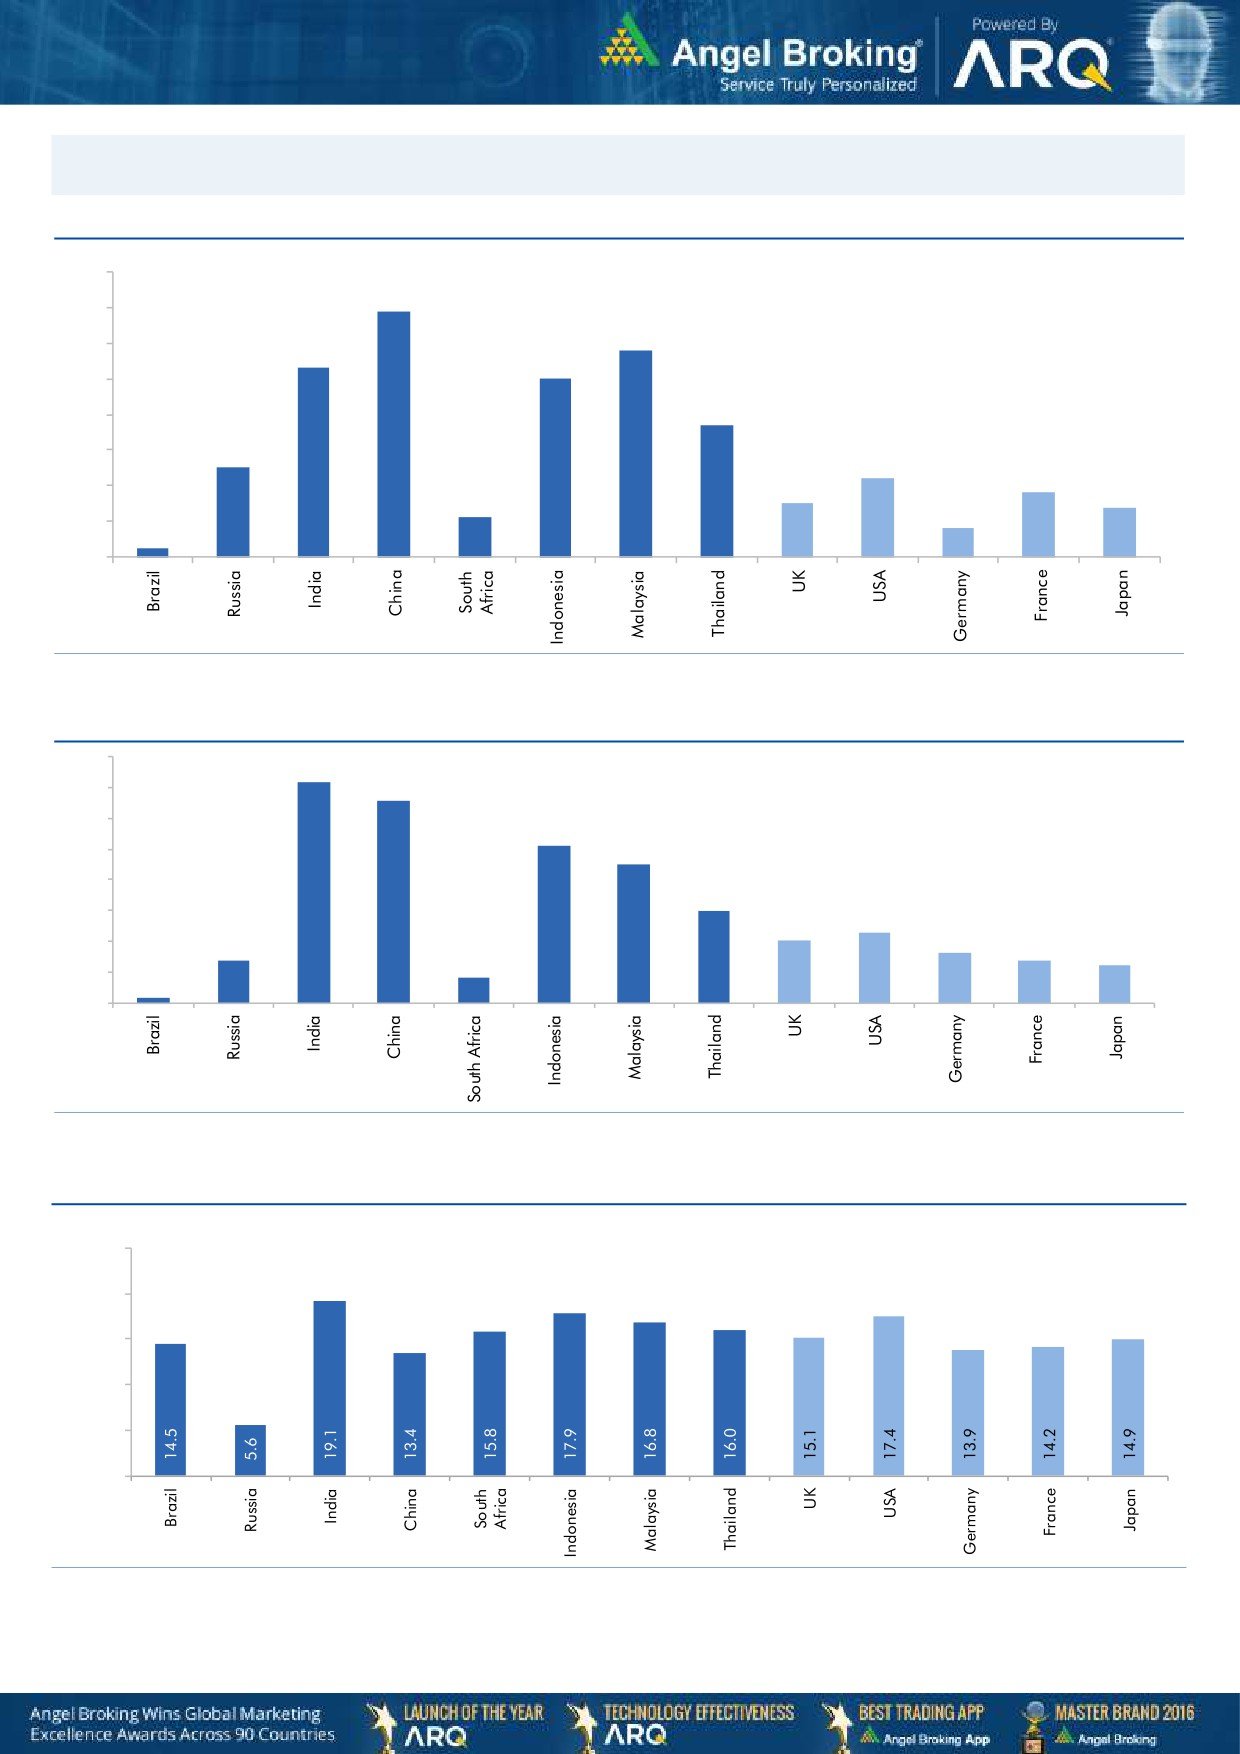
Global watch
Exhibit 1: Latest quarterly GDP Growth (%, yoy) across select developing and developed countries
(%)
8.0
6.9
7.0
5.8
6.0
5.3
5.0
5.0
1.1
3.7
4.0
2.5
3.0
2.2
1.8
2.0
1.5
1.4
0.8
1.0
0.3
-
Source: Bloomberg, Angel Research
Exhibit 2: 2017 GDP Growth projection by IMF (%, yoy) across select developing and developed countries
(%)
7.2
6.6
7.0
6.0
5.1
5.0
4.5
4.0
3.0
3.0
2.3
2.0
1.4
1.6
2.0
1.4
1.2
0.2
0.8
1.0
-
Source: IMF, Angel Research
Exhibit 3: One year forward P-E ratio across select developing and developed countries
(x)
25.0
20.0
15.0
10.0
5.0
-
Source: IMF, Angel Research, data as of 06th Oct-17
Market Outlook
October 09, 2017
Exhibit 4: Relative performance of indices across globe
Returns (%)
Country
Name of index
Closing price
1M
3M
1YR
Brazil
Bovespa
76,055
5.4
22.0
28.2
Russia
Micex
2,094
3.9
8.7
4.6
India
Nifty
9,980
0.3
3.5
14.2
China
Shanghai Composite
3,387
0.8
6.4
11.3
South Africa
Top 40
51,010
2.8
10.9
12.2
Mexico
Mexbol
50,303
(0.4)
(0.6)
4.2
Indonesia
LQ45
985
1.5
0.1
5.8
Malaysia
KLCI
1,764
(0.3)
0.1
5.9
Thailand
SET 50
1,082
4.6
8.6
14.5
USA
Dow Jones
22,774
4.4
6.3
24.9
UK
FTSE
7,523
2.3
2.3
6.0
Japan
Nikkei
20,691
6.7
3.0
25.8
Germany
DAX
12,956
6.9
4.6
23.1
France
CAC
5,360
5.1
3.8
19.9
Source: Bloomberg, Angel Research, data as of 06th Oct-17 p68in4
Stock Watch
October 09, 2017
Company Name
Reco
CMP
Target
Mkt Cap
Sales ( Čcr )
OPM(%)
EPS (Č)
PER(x)
P/BV(x)
RoE(%)
EV/Sales(x)
(Č)
Price ( Č)
( Č cr )
FY18E FY19E
FY18E
FY19E
FY18E
FY19E
FY18E
FY19E
FY18E
FY19E
FY18E
FY19E
FY18E
FY19E
Agri / Agri Chemical
Rallis
Reduce
229
209
4,457
1,873
2,099
15.0
15.0
9.5
10.5
24.1
21.8
3.7
3.3
15.8
16.0
2.3
2.1
United Phosphorus
Neutral
793
-
40,285
18,922
21,949
18.0
18.5
36.2
45.6
21.9
17.4
4.6
3.8
22.7
23.8
2.3
1.9
Auto & Auto Ancillary
Ashok Leyland
Neutral
125
-
36,538
23,339
27,240
10.1
10.8
4.7
6.2
26.9
20.1
5.4
4.7
20.0
23.6
1.5
1.3
Bajaj Auto
Neutral
3,146
-
91,044
23,936
27,955
19.5
20.1
142.7
167.3
22.0
18.8
4.8
4.3
21.8
22.8
3.4
2.8
Bharat Forge
Buy
647
875
30,145
7,637
8,755
21.7
23.2
36.1
47.3
17.9
13.7
3.2
2.7
18.5
20.8
3.8
3.2
Eicher Motors
Neutral
31,541
-
85,863
19,043
22,837
19.5
19.9
835.4
1,019.0
37.8
31.0
14.1
10.9
40.9
37.8
4.4
3.6
Gabriel India
Neutral
198
-
2,850
1,782
2,033
9.7
10.2
7.1
8.9
27.9
22.4
5.6
4.8
21.0
22.2
1.6
1.3
Hero Motocorp
Accumulate
3,704
4,129
73,962
32,239
36,878
16.0
15.6
184.4
206.5
20.1
17.9
6.3
5.5
31.3
30.7
2.1
1.8
Jamna Auto Industries Neutral
62
-
2,474
1,441
1,662
14.4
14.8
13.9
17.6
4.5
3.5
1.2
1.0
30.0
31.0
1.7
1.5
Mahindra and Mahindra Neutral
1,302
-
80,866
46,971
53,816
13.6
14.0
67.7
79.8
19.2
16.3
2.8
2.5
15.0
15.9
1.6
1.4
Maruti
Accumulate
7,910
8,658
238,941
81,825
101,245
15.0
15.0
283.5
356.0
27.9
22.2
6.1
5.0
21.9
22.4
2.6
2.0
Minda Industries
Neutral
856
-
7,399
4,328
5,084
11.0
11.9
27.3
36.4
31.4
23.5
6.7
5.2
23.1
25.6
1.8
1.5
Motherson Sumi
Neutral
341
-
71,860
55,937
64,445
10.8
11.4
16.9
21.1
20.2
16.2
4.5
4.6
25.2
25.4
1.3
1.1
Tata Motors
Neutral
424
-
122,481
303,167
343,649
11.8
13.8
33.1
54.7
12.8
7.8
2.1
1.7
16.9
23.0
0.5
0.4
TVS Motor
Neutral
660
-
31,339
13,992
16,216
9.0
9.4
17.1
20.3
38.7
32.5
10.3
8.0
29.7
27.7
2.2
1.8
Amara Raja Batteries
Buy
703
858
12,015
6,140
7,122
14.3
15.6
29.3
39.0
24.0
18.0
4.1
3.4
17.1
19.0
2.0
1.7
Exide Industries
Neutral
205
-
17,459
8,689
9,854
15.1
15.2
9.7
11.0
21.3
18.7
3.8
3.3
15.7
16.1
1.7
1.5
Apollo Tyres
Neutral
242
-
12,339
15,739
17,326
13.3
14.6
20.4
26.7
11.9
9.1
1.4
1.3
20.4
26.7
1.0
0.9
Ceat
Neutral
1,745
-
7,058
6,661
7,717
11.1
14.2
116.2
178.2
15.0
9.8
2.6
2.2
15.2
21.3
1.2
1.0
JK Tyres
Neutral
150
-
3,406
8,318
9,239
16.2
16.4
21.0
27.5
7.2
5.5
1.4
1.1
19.1
20.4
0.9
0.7
Swaraj Engines
Neutral
2,018
-
2,507
788
889
16.4
16.5
71.6
81.0
28.2
24.9
8.1
7.6
29.6
31.0
2.8
2.5
Subros
Neutral
241
-
1,445
1,855
2,135
11.6
11.8
10.3
14.7
23.5
16.4
3.6
3.1
15.8
19.1
1.0
0.8
Capital Goods
BEML
Neutral
1,739
-
7,243
4,286
5,194
7.1
8.2
42.9
58.1
40.5
29.9
3.3
3.0
7.6
8.7
1.8
1.4
Bharat Electronics
Neutral
166
-
40,835
10,258
12,470
19.6
19.5
7.3
8.6
22.8
19.3
0.4
0.4
20.4
21.9
3.5
2.8
Voltas
Neutral
528
-
17,476
6,778
8,004
9.6
11.0
17.1
22.4
30.9
23.6
7.4
6.5
17.7
19.8
2.3
1.9
BHEL
Neutral
85
-
31,170
33,200
39,167
6.8
9.5
6.2
11.2
13.7
7.6
0.6
0.6
4.6
8.0
0.5
0.4
Blue Star
Accumulate
798
850
7,644
5,220
6,207
6.3
6.6
16.8
22.3
47.5
35.8
9.4
8.3
19.9
23.3
1.4
1.2
CG Power and Industrial
Neutral
81
-
5,067
6,555
7,292
7.5
7.5
-
0.8
8,085.0
101.1
1.3
1.3
0.1
1.2
0.9
0.8
Solutions
Greaves Cotton
Neutral
134
-
3,271
1,778
1,993
14.7
15.1
8.1
9.1
16.5
14.7
3.7
3.5
21.8
23.6
1.6
1.4
Stock Watch
October 09, 2017
Company Name
Reco
CMP
Target
Mkt Cap
Sales ( Čcr )
OPM(%)
EPS (Č)
PER(x)
P/BV(x)
RoE(%)
EV/Sales(x)
(Č)
Price ( Č)
( Č cr )
FY18E FY19E
FY18E
FY19E
FY18E
FY19E
FY18E
FY19E
FY18E
FY19E
FY18E
FY19E
FY18E
FY19E
Capital Goods
KEC International
Accumulate
308
350
7,909
9,779
11,113
9.4
9.8
14.2
18.2
21.7
16.9
4.2
3.4
21.1
22.1
1.1
0.9
KEI Industries
Accumulate
357
380
2,780
3,001
3,391
10.0
10.0
13.0
16.1
27.5
22.2
5.0
4.1
18.2
18.7
1.1
1.0
Thermax
Neutral
929
-
11,073
4,125
4,747
10.3
10.8
26.7
31.5
34.8
29.5
3.9
3.6
11.2
12.0
2.4
2.1
VATech Wabag
Buy
587
681
3,206
3,867
4,126
9.6
10.0
34.9
39.8
16.8
14.8
2.8
2.4
17.7
17.5
0.8
0.8
Cement
ACC
Neutral
1,738
-
32,636
12,255
13,350
13.5
14.3
58.0
66.2
30.0
26.3
3.6
3.3
11.5
12.2
2.6
2.4
Ambuja Cements
Neutral
278
-
55,270
10,250
11,450
17.5
19.0
7.2
8.3
38.7
33.5
2.8
2.6
7.0
7.8
5.2
4.6
India Cements
Neutral
184
-
5,664
6,135
6,750
14.8
15.2
8.5
11.5
21.6
16.0
1.1
1.0
4.8
6.2
1.3
1.1
JK Cement
Neutral
971
-
6,791
4,150
4,775
19.2
20.0
49.0
63.5
19.8
15.3
3.1
2.7
17.0
18.5
2.1
1.8
J K Lakshmi Cement
Neutral
394
-
4,636
3,422
3,757
15.5
17.0
13.5
23.2
29.2
17.0
3.0
2.6
10.8
15.5
1.8
1.5
Orient Cement
Neutral
155
-
3,175
2,215
3,233
16.8
17.0
5.9
6.9
26.3
22.5
2.0
1.9
10.8
10.1
2.4
1.6
UltraTech Cement
Neutral
3,925
-
107,756
28,250
35,150
20.2
23.5
77.5
122.2
50.7
32.1
4.3
3.9
9.6
14.8
4.3
3.4
Construction
KNR Constructions
Neutral
207
-
2,915
1,846
2,203
14.5
14.5
12.1
13.7
17.1
15.2
0.9
0.8
17.5
16.7
1.6
1.4
Larsen & Toubro
Neutral
1,142
-
160,005
95,787
109,476
10.2
11.6
44.5
50.8
25.7
22.5
3.2
3.0
12.9
13.1
2.2
2.0
Gujarat Pipavav Port
Neutral
142
-
6,872
739
842
61.6
62.7
5.1
6.2
27.9
23.1
3.5
3.4
12.7
14.9
8.8
7.6
PNC Infratech
Neutral
150
-
3,835
2,040
2,935
13.0
13.0
6.4
9.0
23.4
16.6
0.6
0.5
9.7
12.2
1.9
1.4
Simplex Infra
Neutral
474
-
2,346
6,012
6,619
11.6
11.7
21.1
31.0
22.5
15.3
1.6
1.4
6.5
8.6
0.9
0.8
Sadbhav Engineering
Neutral
287
-
4,927
3,823
4,426
10.7
10.8
10.3
11.8
27.9
24.3
3.3
2.9
10.1
10.5
1.6
1.4
NBCC
Neutral
216
-
19,449
9,099
12,706
6.4
6.4
7.3
9.6
29.7
22.6
1.3
1.0
27.5
30.5
2.0
1.4
MEP Infra
Neutral
101
-
1,647
2,403
2,910
18.3
16.8
2.4
6.1
43.1
16.7
16.3
11.0
35.2
55.8
1.8
1.5
SIPL
Neutral
99
-
3,492
2,060
2,390
46.8
47.7
(5.8)
(3.1)
3.7
4.2
(14.2)
(2.3)
6.5
6.0
Engineers India
Neutral
149
-
10,010
1,795
2,611
21.1
22.4
5.9
8.1
25.2
18.3
1.8
1.7
12.9
16.1
4.0
2.6
Financials
Axis Bank
Accumulate
504
580
120,947
32,558
35,843
3.5
3.2
27.8
41.0
18.1
12.3
2.0
1.7
11.4
14.9
-
-
Bank of Baroda
Neutral
142
-
32,696
22,533
26,079
2.4
2.4
12.0
20.9
11.8
6.8
0.8
0.7
6.6
11.0
-
-
Canara Bank
Neutral
315
-
18,830
17,925
20,235
2.0
2.1
18.5
36.5
17.0
8.6
0.6
0.6
3.4
6.2
-
-
Can Fin Homes
Neutral
2,646
-
7,043
586
741
3.5
3.5
107.8
141.0
24.5
18.8
5.4
4.4
24.1
25.6
-
-
Cholamandalam Inv. &
Accumulate
1,118
1,230
17,476
2,826
3,307
6.3
6.3
53.7
64.6
20.8
17.3
3.6
3.0
18.3
18.9
-
-
Fin. Co.
Dewan Housing Finance Accumulate
547
610
17,137
2,676
3,383
2.4
2.7
37.4
49.7
14.6
11.0
1.9
1.7
13.8
16.2
-
-
Equitas Holdings
Buy
154
235
5,226
1,125
1,380
9.6
9.8
1.5
6.0
102.8
25.7
2.3
2.2
2.4
8.2
-
-
Federal Bank
Accumulate
118
125
22,938
4,896
5,930
2.8
3.1
5.4
7.6
21.9
15.6
1.9
1.7
8.5
11.0
-
-
Stock Watch
October 09, 2017
Company Name
Reco
CMP
Target
Mkt Cap
Sales ( Čcr )
OPM(%)
EPS (Č)
PER(x)
P/BV(x)
RoE(%)
EV/Sales(x)
(Č)
Price ( Č)
( Č cr )
FY18E FY19E
FY18E
FY19E
FY18E
FY19E
FY18E
FY19E
FY18E
FY19E
FY18E
FY19E
FY18E
FY19E
Financials
GIC Housing
Buy
512
655
2,754
376
477
3.6
3.7
33.0
40.0
15.5
12.8
2.8
2.4
20.0
23.0
-
-
HDFC Bank
Neutral
1,799
-
464,470
55,236
63,253
4.5
4.4
68.9
82.4
26.1
21.8
4.6
3.8
18.7
18.5
-
-
ICICI Bank
Buy
272
315
174,679
42,361
51,378
3.6
3.9
18.4
25.7
14.8
10.6
1.6
1.6
11.3
15.0
-
-
Karur Vysya Bank
Buy
143
180
8,639
3,289
3,630
3.7
3.9
10.8
14.1
13.2
10.2
1.6
1.4
12.5
14.7
-
-
LIC Housing Finance
Neutral
662
-
33,409
4,895
6,332
3.4
3.7
50.7
66.8
13.1
9.9
2.6
2.2
21.7
23.8
-
-
Punjab Natl.Bank
Neutral
137
-
29,121
23,708
25,758
2.1
2.1
5.9
16.4
23.3
8.3
0.7
0.7
3.0
8.3
-
-
RBL Bank
Neutral
516
-
21,318
2,309
2,888
2.6
2.5
16.4
19.1
31.5
27.1
4.0
3.5
13.3
13.8
-
-
Repco Home Finance
Buy
637
825
3,983
496
597
4.4
4.2
38.5
48.7
16.6
13.1
3.0
2.5
19.6
20.6
-
-
South Ind.Bank
Neutral
32
-
5,693
3,195
3,567
3.0
3.1
3.0
3.8
10.5
8.2
1.0
0.9
10.5
11.9
-
-
St Bk of India
Neutral
257
-
221,542
105,827
121,056
2.4
2.5
16.1
25.6
16.0
10.0
1.3
1.1
6.6
9.9
-
-
Union Bank
Neutral
130
-
9,407
14,650
16,225
2.3
2.3
23.1
32.5
5.6
4.0
0.4
0.4
7.1
9.2
-
-
Yes Bank
Neutral
365
-
83,624
11,088
13,138
3.0
2.9
84.0
99.3
4.4
3.7
0.7
0.6
16.3
16.8
-
-
FMCG
Akzo Nobel India
Neutral
1,862
-
8,931
3,164
3,607
13.8
13.7
58.6
67.9
31.8
27.4
7.8
6.9
24.5
25.1
2.7
2.3
Asian Paints
Neutral
1,159
-
111,161
17,603
20,615
18.6
18.6
2,128.9
2,543.3
0.5
0.5
11.5
9.7
28.0
28.9
6.1
5.2
Britannia
Neutral
4,356
-
52,302
9,690
11,278
14.8
15.4
84.0
101.0
51.9
43.1
18.9
15.0
40.6
39.0
5.4
4.6
Colgate
Neutral
1,089
-
29,622
4,420
5,074
24.9
25.3
28.6
32.8
38.1
33.2
15.0
12.1
43.8
40.5
6.5
5.6
Dabur India
Neutral
316
-
55,664
8,346
9,344
19.6
19.9
7.8
9.0
40.5
35.1
8.2
7.4
25.2
24.8
6.3
5.5
GlaxoSmith Con*
Neutral
5,005
-
21,049
5,072
5,760
18.2
18.4
176.3
199.2
28.4
25.1
6.0
5.5
21.2
21.7
3.5
3.0
Godrej Consumer
Neutral
947
-
64,549
10,171
11,682
20.8
21.5
21.7
27.1
43.7
35.0
9.8
8.4
22.3
23.4
6.5
5.6
HUL
Neutral
1,206
-
260,928
37,077
41,508
20.3
21.8
5,189.9
6,318.5
0.2
0.2
36.8
31.4
74.8
82.0
6.9
6.2
ITC
Neutral
266
-
324,057
44,588
49,853
37.0
37.3
9.6
11.0
27.7
24.2
6.8
6.5
25.1
27.3
6.8
6.0
Marico
Neutral
314
-
40,547
6,788
7,766
18.5
19.2
7.1
8.5
44.3
37.0
15.5
13.3
36.9
38.0
5.8
5.1
Nestle*
Neutral
7,342
-
70,786
10,083
11,182
20.0
20.9
119.7
141.3
61.3
52.0
216.2
197.6
36.7
39.8
6.7
6.0
Tata Global
Neutral
210
-
13,228
7,121
7,641
11.9
12.3
6.9
8.0
30.4
26.2
2.0
1.9
6.8
7.2
1.7
1.5
Procter & Gamble
Neutral
8,600
-
27,916
3,034
3,579
27.1
27.7
167.7
198.8
51.3
43.3
13.8
11.9
28.8
29.5
8.6
7.2
Hygiene
IT
HCL Tech^
Accumulate
904
1,014
129,057
52,342
57,053
20.9
20.9
62.8
67.6
14.4
13.4
3.2
2.8
22.4
20.6
2.1
1.9
Infosys
Buy
919
1,179
211,195
73,963
80,619
26.0
26.0
64.4
69.3
14.3
13.3
2.8
2.6
19.7
19.6
2.3
2.0
TCS
Accumulate
2,445
2,651
481,799
127,403
138,870
27.6
27.6
144.5
156.0
16.9
15.7
5.0
4.7
29.7
29.8
3.4
3.1
Tech Mahindra
Buy
455
533
44,433
31,015
33,496
15.0
15.0
35.6
38.1
12.8
12.0
2.2
2.0
17.0
16.3
1.2
1.0
Stock Watch
October 09, 2017
Company Name
Reco
CMP
Target
Mkt Cap
Sales ( Čcr )
OPM(%)
EPS (Č)
PER(x)
P/BV(x)
RoE(%)
EV/Sales(x)
(Č)
Price ( Č)
( Č cr )
FY18E FY19E
FY18E
FY19E
FY18E
FY19E
FY18E
FY19E
FY18E
FY19E
FY18E
FY19E
FY18E
FY19E
IT
Wipro
Neutral
286
-
139,309
58,536
61,858
20.3
20.3
18.2
19.1
15.7
15.0
2.4
2.1
14.6
13.4
2.3
2.2
Media
D B Corp
Neutral
380
-
6,988
2,404
2,625
30.5
31.5
23.7
26.9
16.0
14.1
3.8
3.2
23.5
22.8
2.8
2.5
HT Media
Neutral
98
-
2,279
2,589
2,830
15.1
15.4
8.3
10.9
11.8
9.0
1.0
0.9
8.4
10.4
0.4
0.3
Jagran Prakashan
Buy
179
225
5,847
2,541
2,835
28.5
28.7
12.7
14.1
14.1
12.7
2.9
2.5
21.3
21.4
2.2
1.9
Sun TV Network
Neutral
783
-
30,875
3,238
3,789
51.9
55.1
30.9
38.0
25.4
20.6
7.2
6.3
30.0
31.0
9.0
7.6
Hindustan Media
Neutral
252
-
1,850
1,002
1,074
23.3
23.5
29.2
33.8
8.6
7.5
1.3
1.2
15.6
15.4
0.8
0.6
Ventures
TV Today Network
Buy
361
435
2,153
667
727
27.7
27.7
18.6
20.1
19.4
18.0
3.0
3.1
15.6
17.3
2.8
2.6
Music Broadcast Limited Accumulate
392
434
2,238
271
317
91.0
109.0
6.0
10.0
65.4
39.2
4.1
3.7
6.5
9.3
7.9
6.5
Metals & Mining
Coal India
Neutral
276
-
171,604
82,301
91,235
17.0
18.0
17.1
20.5
16.2
13.5
3.0
2.9
45.0
55.0
1.8
1.6
Hind. Zinc
Neutral
319
-
134,809
22,108
24,555
57.0
58.0
22.1
26.3
14.4
12.1
4.7
3.8
32.0
35.0
5.1
4.3
Hindalco
Neutral
251
-
56,247
102,350
105,355
13.5
14.5
21.5
24.5
11.7
10.2
1.6
1.4
15.0
15.2
1.1
1.1
JSW Steel
Neutral
257
-
62,171
64,500
68,245
21.1
21.5
20.1
21.2
12.8
12.1
2.3
2.0
-
-
1.7
1.6
NMDC
Neutral
122
-
38,679
10,209
11,450
47.0
48.0
11.1
12.1
11.0
10.1
1.5
1.4
-
-
3.3
3.0
SAIL
Neutral
56
-
23,252
54,100
63,555
3.0
10.0
(10.0)
1.5
37.5
0.8
0.7
-
-
1.4
1.2
Vedanta
Neutral
327
-
121,608
81,206
87,345
28.0
29.0
26.5
33.5
12.4
9.8
2.8
2.4
-
-
2.2
1.9
Tata Steel
Neutral
691
-
67,150
121,445
126,500
16.2
17.2
65.4
81.3
10.6
8.5
1.7
1.4
-
-
1.1
0.9
Oil & Gas
GAIL
Neutral
452
-
76,498
53,115
52,344
14.2
15.3
30.0
31.1
15.1
14.5
1.9
1.7
-
-
1.2
1.2
ONGC
Neutral
174
-
222,913
83,111
84,934
44.2
44.9
16.4
16.9
10.6
10.3
1.3
1.2
-
-
2.6
2.5
Indian Oil Corp
Neutral
415
-
201,739
396,116
432,560
8.5
8.8
40.1
42.2
10.4
9.8
1.8
1.6
-
-
0.7
0.6
Reliance Industries
Neutral
837
-
544,271
257,711
267,438
17.0
18.2
89.1
89.5
9.4
9.4
0.9
0.8
-
-
1.8
1.7
Pharmaceuticals
Alembic Pharma
Buy
502
600
9,464
3,903
4,584
18.2
19.2
21.8
27.2
23.0
18.5
4.2
3.5
19.8
20.6
2.4
2.1
Alkem Laboratories Ltd
Accumulate
1,852
2,079
22,138
6,320
7,341
17.5
19.8
72.7
96.6
25.5
19.2
4.5
3.8
16.7
18.7
3.4
2.9
Aurobindo Pharma
Accumulate
744
823
43,596
17,086
19,478
22.1
22.0
44.7
51.4
16.7
14.5
3.7
3.0
24.7
22.7
2.7
2.3
Aventis*
Neutral
4,069
-
9,371
2,508
2,862
16.8
16.8
139.9
153.8
29.1
26.5
4.2
3.4
23.5
25.8
3.4
2.8
Cadila Healthcare
Reduce
501
426
51,243
11,584
13,228
20.3
20.4
18.7
21.3
26.8
23.5
6.0
4.9
24.6
22.9
4.2
3.7
Cipla
Sell
585
458
47,074
16,619
19,437
15.4
16.2
19.7
24.3
29.7
24.1
3.4
3.0
12.0
13.2
3.0
2.5
Dr Reddy's
Neutral
2,378
-
39,423
15,844
17,973
17.6
18.2
91.7
111.0
25.9
21.4
3.0
2.7
11.9
13.0
2.7
2.4
GSK Pharma*
Neutral
2,415
-
20,454
3,260
3,651
15.0
18.0
46.1
58.6
52.4
41.2
10.8
11.1
20.0
26.5
6.2
5.6
Indoco Remedies
Sell
222
153
2,042
1,154
1,310
14.9
14.9
11.3
12.7
19.6
17.5
2.8
2.5
15.0
15.0
1.9
1.6
Stock Watch
October 09, 2017
Company Name
Reco
CMP
Target
Mkt Cap
Sales ( Čcr )
OPM(%)
EPS (Č)
PER(x)
P/BV(x)
RoE(%)
EV/Sales(x)
(Č)
Price ( Č)
( Č cr )
FY18E FY19E
FY18E
FY19E
FY18E
FY19E
FY18E
FY19E
FY18E
FY19E
FY18E
FY19E
FY18E
FY19E
Pharmaceuticals
Ipca labs
Neutral
520
-
6,564
3,593
4,022
14.5
15.5
19.4
25.2
26.8
20.6
2.4
2.2
9.5
11.2
1.9
1.7
Lupin
Buy
1,042
1,467
47,091
18,657
21,289
21.3
23.3
52.8
66.7
19.7
15.6
3.0
2.5
16.3
17.5
2.5
2.1
Natco Pharma
Accumulate
993
1,057
17,311
1,886
2,016
32.3
29.5
23.2
22.0
42.9
45.1
9.0
7.9
20.9
17.6
9.0
8.4
Sun Pharma
Accumulate
530
558
127,256
32,899
36,451
26.9
25.4
31.6
32.3
16.8
16.4
3.0
2.6
18.7
18.8
3.5
3.0
Syngene International
Accumulate
490
557
9,801
1,402
1,823
32.8
36.0
15.9
20.7
30.9
23.7
5.8
4.7
18.7
20.0
7.0
5.3
Power
Tata Power
Neutral
81
-
21,814
32,547
33,806
20.5
20.5
4.7
5.4
17.2
15.1
1.6
1.4
10.5
10.5
1.7
1.6
NTPC
Neutral
175
-
144,667
86,070
101,246
28.3
30.7
12.9
16.2
13.6
10.8
1.4
1.3
10.6
12.4
3.0
2.7
Power Grid
Accumulate
205
223
107,143
29,183
32,946
89.7
90.0
18.0
20.8
11.4
9.9
1.9
1.7
17.7
18.2
7.6
7.1
Real Estate
Prestige Estate
Neutral
289
-
10,830
4,607
5,146
21.0
22.2
7.9
9.8
36.6
29.5
2.3
2.1
10.3
12.0
3.5
3.2
MLIFE
Accumulate
469
522
2,407
487
590
12.3
17.8
21.0
31.2
22.3
15.0
1.2
1.1
5.2
7.4
3.7
3.0
Telecom
Bharti Airtel
Neutral
382
-
152,821
97,903
105,233
36.0
36.3
9.3
11.1
41.1
34.6
2.0
1.9
5.0
5.6
2.5
2.3
Idea Cellular
Neutral
74
-
26,619
35,012
37,689
27.1
27.7
(4.4)
(2.7)
1.2
1.2
(6.8)
(4.6)
2.1
1.9
zOthers
Abbott India
Neutral
4,148
-
8,815
3,244
3,723
14.9
16.1
167.5
209.4
24.8
19.8
5.5
4.6
23.7
24.8
2.4
2.0
Asian Granito
Buy
487
570
1,465
1,169
1,286
12.5
12.5
16.0
19.7
30.5
24.7
3.3
2.9
10.7
11.6
1.5
1.3
Bajaj Electricals
Accumulate
367
395
3,721
4,646
5,301
6.7
7.6
16.1
22.3
22.8
16.4
3.7
3.2
16.4
19.2
0.8
0.7
Banco Products (India)
Neutral
211
-
1,509
1,530
1,695
13.2
12.7
19.0
20.0
11.1
10.6
1.8
1.6
0.2
0.2
0.9
99.4
Coffee Day Enterprises
Neutral
218
-
4,481
3,494
3,913
17.4
18.0
4.8
5.7
-
38.2
1.9
1.8
-
0.1
1.7
1.5
Ltd
Elecon Engineering
Neutral
64
-
723
171
201
15.0
16.2
36.0
43.0
1.8
1.5
0.2
0.1
0.1
0.1
3.6
3.1
Garware Wall Ropes
Neutral
918
-
2,009
928
1,003
15.2
15.2
39.4
43.2
23.3
21.3
3.8
3.3
16.5
15.4
2.0
1.8
Goodyear India*
Neutral
807
-
1,861
1,717
1,866
11.8
12.3
47.9
49.8
16.8
16.2
2.6
2.3
15.6
15.7
0.8
111.5
Hitachi
Neutral
2,016
-
5,483
2,355
2,715
10.3
10.8
49.0
60.9
41.2
33.1
9.6
7.6
0.2
0.2
2.4
2.0
HSIL
Neutral
391
-
2,828
2,240
2,670
14.6
15.0
17.0
22.0
23.0
17.8
1.9
1.8
0.1
0.1
1.5
1.2
Interglobe Aviation
Neutral
1,107
-
40,049
22,570
27,955
14.2
15.0
63.6
81.8
17.4
13.5
9.2
7.7
0.5
0.6
1.5
1.1
Jyothy Laboratories
Neutral
401
-
7,276
1,781
2,044
14.1
15.0
9.4
10.5
42.8
38.1
9.1
8.6
0.2
0.2
4.3
3.7
Linc Pen & Plastics
Neutral
244
-
360
420
462
9.3
9.3
15.3
17.1
15.9
14.2
2.7
2.8
16.9
19.5
0.9
0.8
M M Forgings
Neutral
734
-
886
542
642
20.1
21.0
41.6
56.8
17.7
12.9
2.4
2.1
0.1
0.2
2.0
1.8
Mirza International
Neutral
164
-
1,968
1,148
1,285
18.0
18.0
8.0
9.4
20.4
17.5
3.4
2.8
16.3
16.1
1.9
1.6
Navkar Corporation
Buy
184
265
2,623
561
617
41.5
41.5
11.5
12.7
16.0
14.5
1.7
1.5
10.5
10.4
5.3
4.6
Nilkamal
Neutral
1,563
-
2,332
2,317
2,525
11.4
11.1
96.0
105.0
16.3
14.9
2.8
2.4
0.2
0.2
1.0
0.9
Stock Watch
October 09, 2017
Company Name
Reco
CMP
Target Mkt Cap
Sales ( Čcr )
OPM(%)
EPS (Č)
PER(x)
P/BV(x)
RoE(%)
EV/Sales(x)
(Č)
Price ( Č)
( Č cr )
FY18E FY19E FY18E FY19E FY18E FY19E FY18E FY19E FY18E FY19E FY18E FY19E FY18E FY19E
zOthers
Parag Milk Foods
Neutral
262
-
2,203
1,987
2,379
7.6
9.0
12.4
18.3
21.1
14.3
3.0
2.6
8.2
13.2
1.2
1.0
Radico Khaitan
Neutral
172
-
2,296
1,811
1,992
13.2
13.2
8.1
8.8
21.3
19.6
2.2
2.4
10.1
12.0
1.6
1.5
Relaxo Footwears
Neutral
518
-
6,220
1,981
2,310
13.7
14.5
12.0
15.5
43.2
33.4
8.4
6.8
0.2
0.2
3.2
2.7
Siyaram Silk Mills
Accumulate
2,428
2,600
2,276
1,769
1,981
12.7
12.7
113.1
131.1
21.5
18.5
3.3
2.9
15.5
15.5
1.5
1.3
Styrolution ABS India* Neutral
1,003
-
1,764
1,800
1,980
8.0
8.1
42.0
46.2
23.9
21.7
2.7
2.4
0.1
0.1
1.1
1.0
Surya Roshni
Neutral
315
-
1,379
4,870
5,320
7.7
7.8
22.8
28.1
13.8
11.2
1.8
1.6
0.1
0.1
0.5
0.4
TVS Srichakra
Neutral
3,003
-
2,300
2,729
2,893
12.7
12.5
248.5
265.0
12.1
11.3
3.4
2.8
0.3
0.3
0.8
0.8
Visaka Industries
Neutral
709
-
1,125
1,104
1,214
12.1
12.6
31.0
37.9
22.9
18.7
2.8
2.5
0.1
0.1
1.2
1.1
VIP Industries
Accumulate
262
300
3,700
1,450
1,693
10.4
10.5
6.5
7.8
40.0
33.5
8.5
7.4
21.1
22.1
2.5
2.2
Navin Fluorine
Neutral
753
-
3,714
945
1,154
22.4
22.6
28.7
34.8
26.3
21.7
4.3
3.7
-
-
3.4
2.7
Source: Company, Angel Research; Note: *December year end; #September year end; &October year end; Price as on October 06, 2017
Market Outlook
October 09, 2017
Research Team Tel: 022 - 39357800
DISCLAIMER
Angel Broking Private Limited (hereinafter referred to as “Angel”) is a registered Member of National Stock Exchange of India
Limited,Bombay Stock Exchange Limited and Metropolitan Stock Exchange Limited. It is also registered as a Depository Participant with
CDSL and Portfolio Manager with SEBI. It also has registration with AMFI as a Mutual Fund Distributor. Angel Broking Private Limited is a
registered entity with SEBI for Research Analyst in terms of SEBI (Research Analyst) Regulations, 2014 vide registration number
INH000000164. Angel or its associates has not been debarred/ suspended by SEBI or any other regulatory authority for accessing
/dealing in securities Market. Angel or its associates/analyst has not received any compensation / managed or
co-managed public offering of securities of the company covered by Analyst during the past twelve months.
This document is solely for the personal information of the recipient, and must not be singularly used as the basis of any investment
decision. Nothing in this document should be construed as investment or financial advice. Each recipient of this document should make
such investigations as they deem necessary to arrive at an independent evaluation of an investment in the securities of the companies
referred to in this document (including the merits and risks involved), and should consult their own advisors to determine the merits and
risks of such an investment.
Reports based on technical and derivative analysis center on studying charts of a stock's price movement, outstanding positions and
trading volume, as opposed to focusing on a company's fundamentals and, as such, may not match with a report on a company's
fundamentals. Investors are advised to refer the Fundamental and Technical Research Reports available on our website to evaluate the
contrary view, if any.
The information in this document has been printed on the basis of publicly available information, internal data and other reliable
sources believed to be true, but we do not represent that it is accurate or complete and it should not be relied on as such, as this
document is for general guidance only. Angel Broking Pvt. Limited or any of its affiliates/ group companies shall not be in any way
responsible for any loss or damage that may arise to any person from any inadvertent error in the information contained in this report.
Angel Broking Pvt. Limited has not independently verified all the information contained within this document. Accordingly, we cannot
testify, nor make any representation or warranty, express or implied, to the accuracy, contents or data contained within this document.
While Angel Broking Pvt. Limited endeavors to update on a reasonable basis the information discussed in this material, there may be
regulatory, compliance, or other reasons that prevent us from doing so.
This document is being supplied to you solely for your information, and its contents, information or data may not be reproduced,
redistributed or passed on, directly or indirectly.
Neither Angel Broking Pvt. Limited, nor its directors, employees or affiliates shall be liable for any loss or damage that may arise from
or in connection with the use of this information.